Visualisation: exporting

Hi community!
While responding to your reviews, I’ve noticed a recurring question: “How can I export my Gantt chart so that it looks clean and readable in PNG or PDF?”. Here are a few practical tips that might help:
-
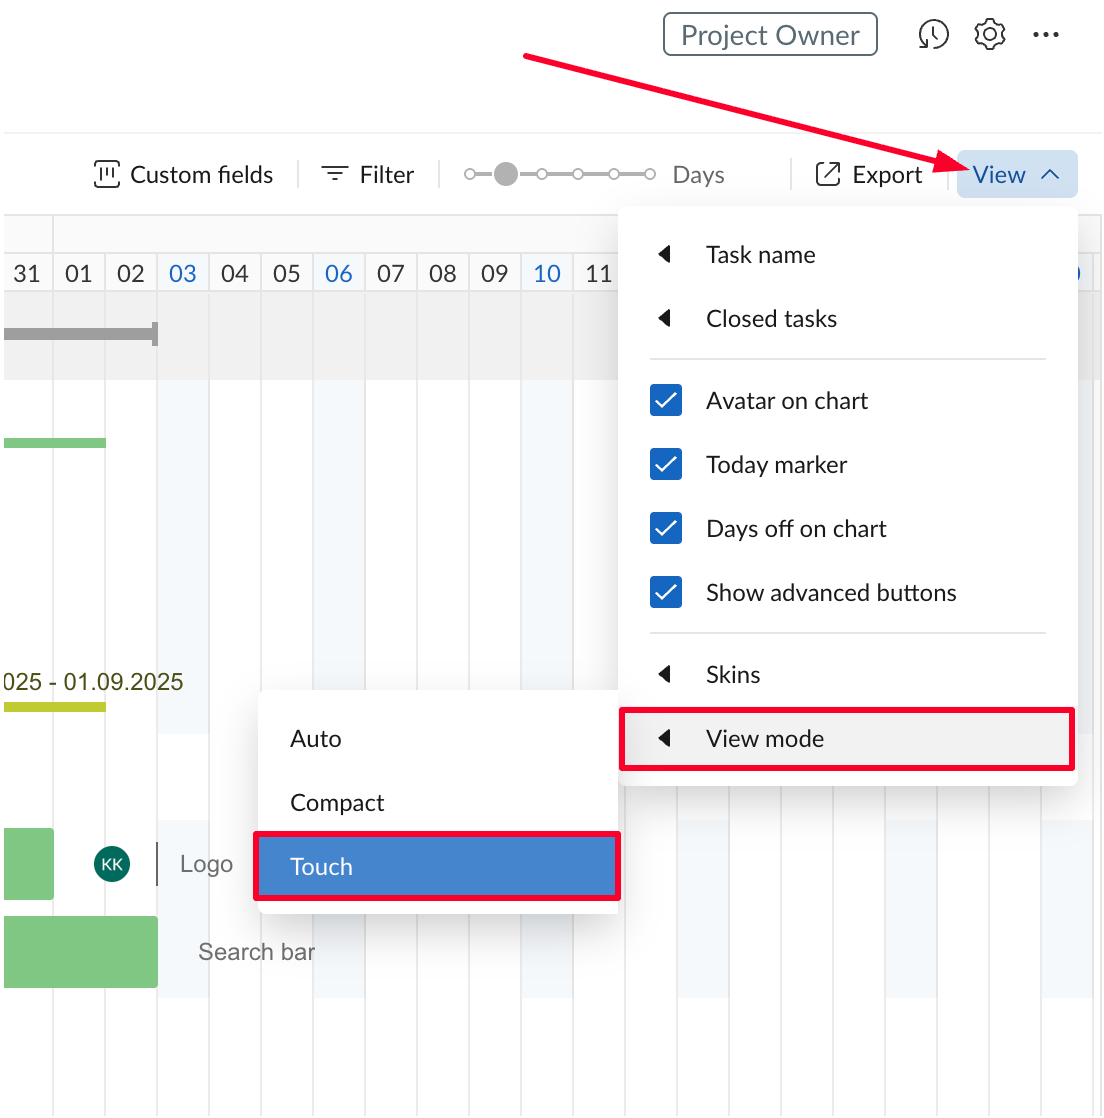
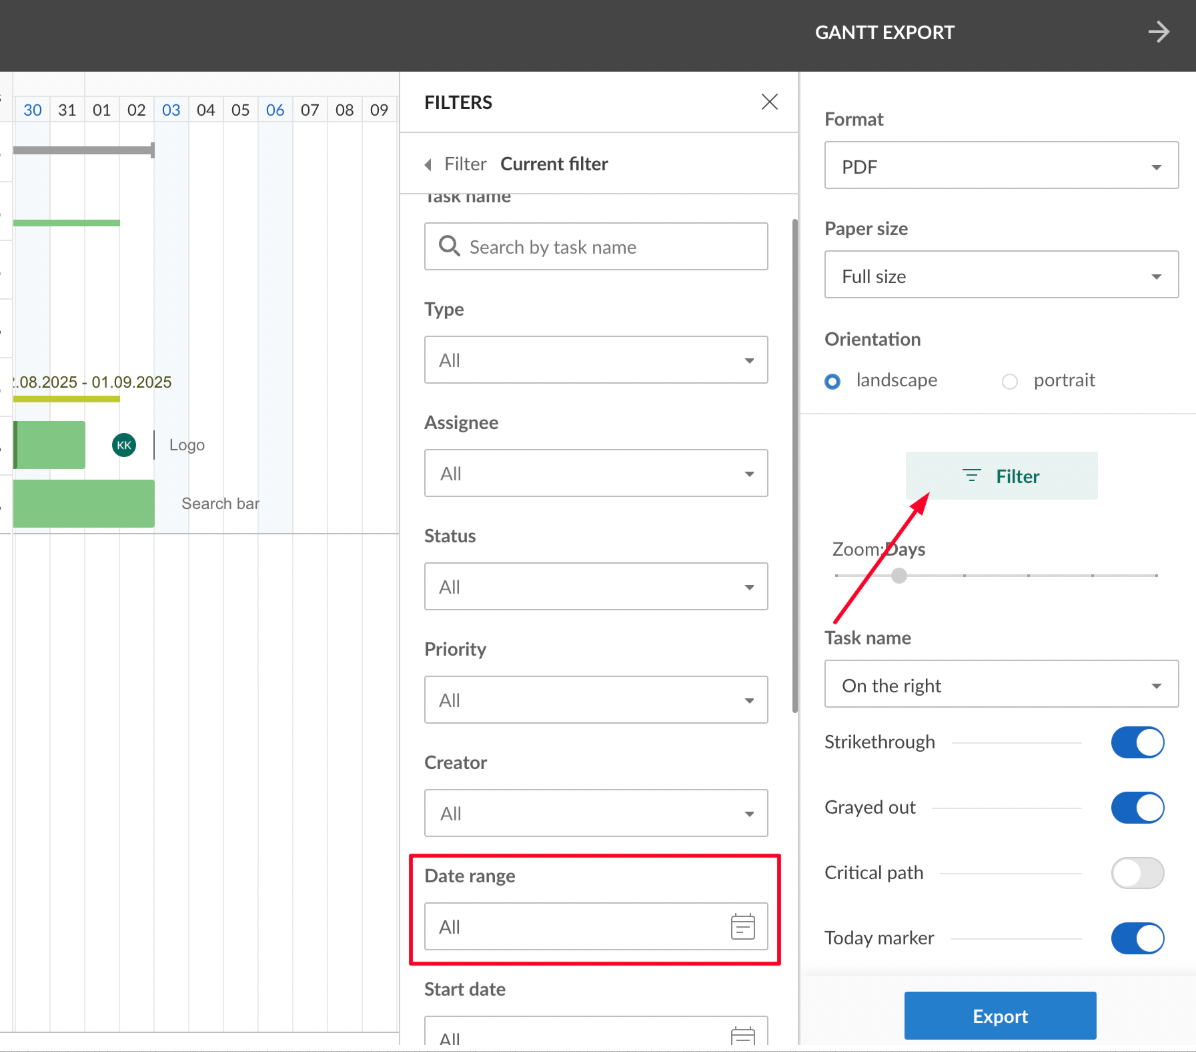
Switch the View mode to “Touch”. This makes the chart more spacious and often improves readability. Also, on the export page, you can refine the output by setting a specific Date range – from the project’s start date to its end date.
-
Export your diagram in smaller time periods using the “Date range” filter.
For example: September => April, May => August, September => December. Breaking the timeline into segments can make long projects much easier to present and read.
To improve the export experience further, I’d love to hear from you: what do you feel is currently lacking in GanttPRO’s export options, or what would make your PDF/PNG outputs clearer and more usable?